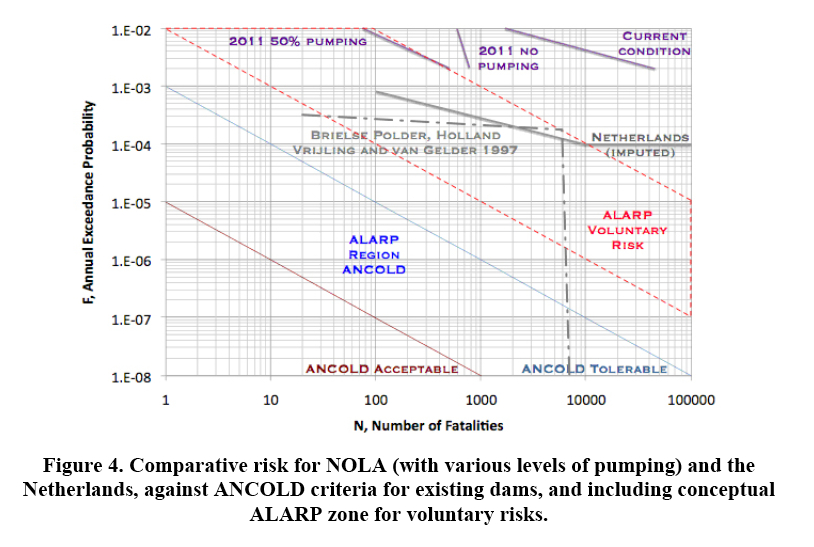
From here: Managing Risk to Humans and to Floodplain Resources (PDF). The chart shows chance of a levee breach on the vertical axis and number of fatalities on the horizontal axis.
When this chart was put up at the Tulane Engineering Forum, the audience took a second to process it (note the log-log scale), but when they did, there was a gasp. It's not every day you see a graph of fatalities on a logarithmic scale. Each line is 10 times worse than the line preceding it. You don't want to see the New Orleans levees in the upper right quadrant of this chart.
The big point I was going to make in the long post I never wrote was we need MUCH more than 100-year level levees.
Related: Residual Risk / YRHT. Very good quote from Dr. Bea.
More here:
Risk-based design of flood defense systems (PDF).
Remember, hurricane season is less than 3 weeks away.
UPDATE- Some minor edits.
UPDATE 2 - Presentations Online
2 comments:
Outstanding. I think you know I totally agree that 1% chance annual exceedence is NOT going to cut it. The problem we have is that coastal flood protection is not viewed as a life-safety system. The Federal government's interest in this lies entirely in flood insurance--insurance of property only. Dam safety, quite to the contrary, is pegged to potential loss of life and thus you do see higher levels of risk reduction.
I'm also glad you posted a link to the paper on Risk-based design of flood defenses. Everyone at my office is committed to this approach to protection from storm surge and waves. You will be pleased to know that one of the authors of that report, Mathijs Van Ledden, works full time for the Corps in New Orleans via a contract with Royal Haskoning.
The science and engineerng is there. What we need now is the political and economic will to make it happen.
Peace,
Tim
It's not every day when you see a chart about New Orleans' levees presented at an engineering conference with "100,000 fatalities" listed on an axis...
Post a Comment