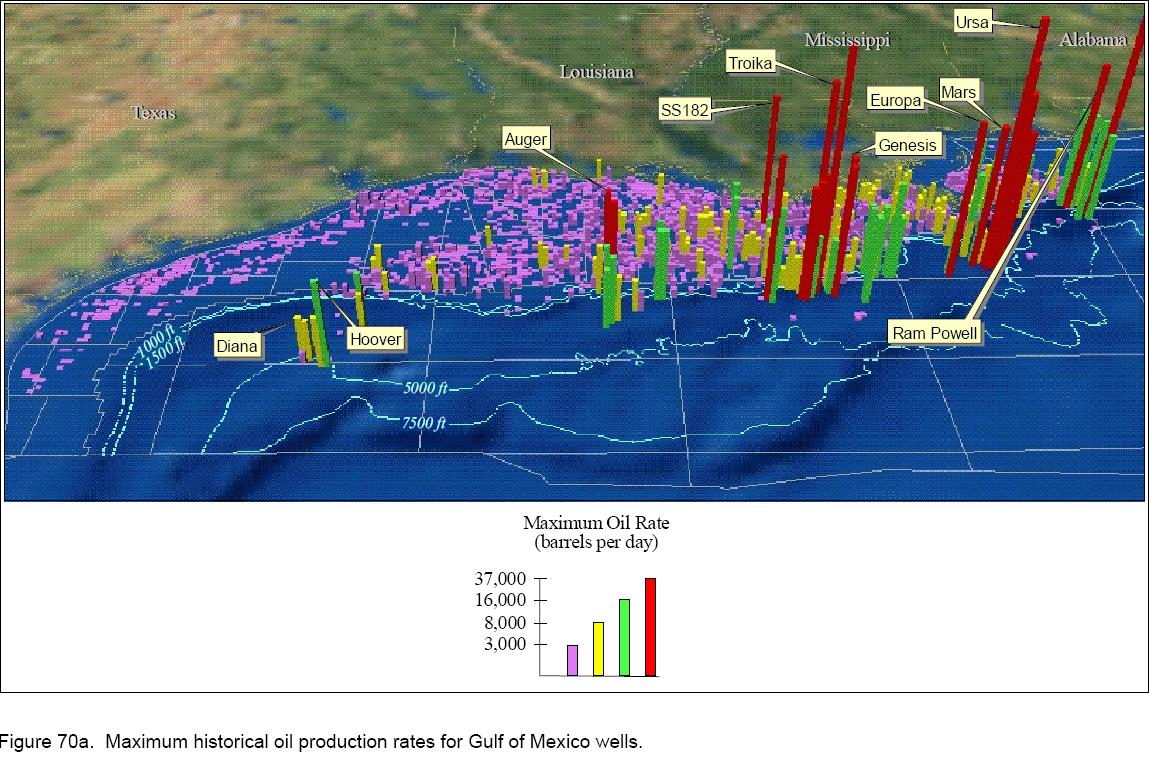
I like this image a lot. Found it here. The data is based off 2003 MMS well data, so it's pretty far out of date on the deepwater fields, but it illustrates how deepwater production is the lynchpin of US offshore oil production (the lion's share of the ~1.6-1.8 Million Barrels a day we produce offshore). The chart is organized based off the maximum historical production rate (B/D) by leaseblock. Note that the shallow fields have history back as far as the 1940's, while there are plenty of blocks now (2011) in production that aren't even show on the map. If the map were updated with today's information, it would look even more lopsided.
No comments:
Post a Comment